How to Determine the Optimal Heating Temperature for a plastic sample?
by Henry Steinberg
Knowledge
Not every plastic sample has a clearly defined ideal measurement temperature. In such cases, established procedures outlined in the following standards can help:
-
ASTM D6869 – 17 „Standard Test Method for Coulometric and Volumetric Determination of Moisture in Plastics Using the Karl Fischer Reaction“, Kapitel 10.9 Selection of Optimum Heating Temperature (ASTM International, 2017)
-
DIN EN ISO 15512:2019 „Plastics – Determination of water content“, Anhang B Selection of the optimum heating temperature and heating time for the water content determination (DIN e.V., 2019)
Key difference: ASTM D6869 – 17 focuses exclusively on Karl Fischer titration, whereas DIN EN ISO 15512:2019 also covers other methods, such as the calcium hydride technique.
How to Determine the Optimal Heating Temperature
1. Multiple measurements at different temperatures
The sample is tested at a range of temperatures. The water content is measured for each temperature.
2. Plot the results
Results are visualized in an x-y diagram, with temperature on the x-axis and water content on the y-axis. Typical measurement ranges are between 120 °C and 220 °C, with recommended temperature increments of 5 °C or 10 °C.
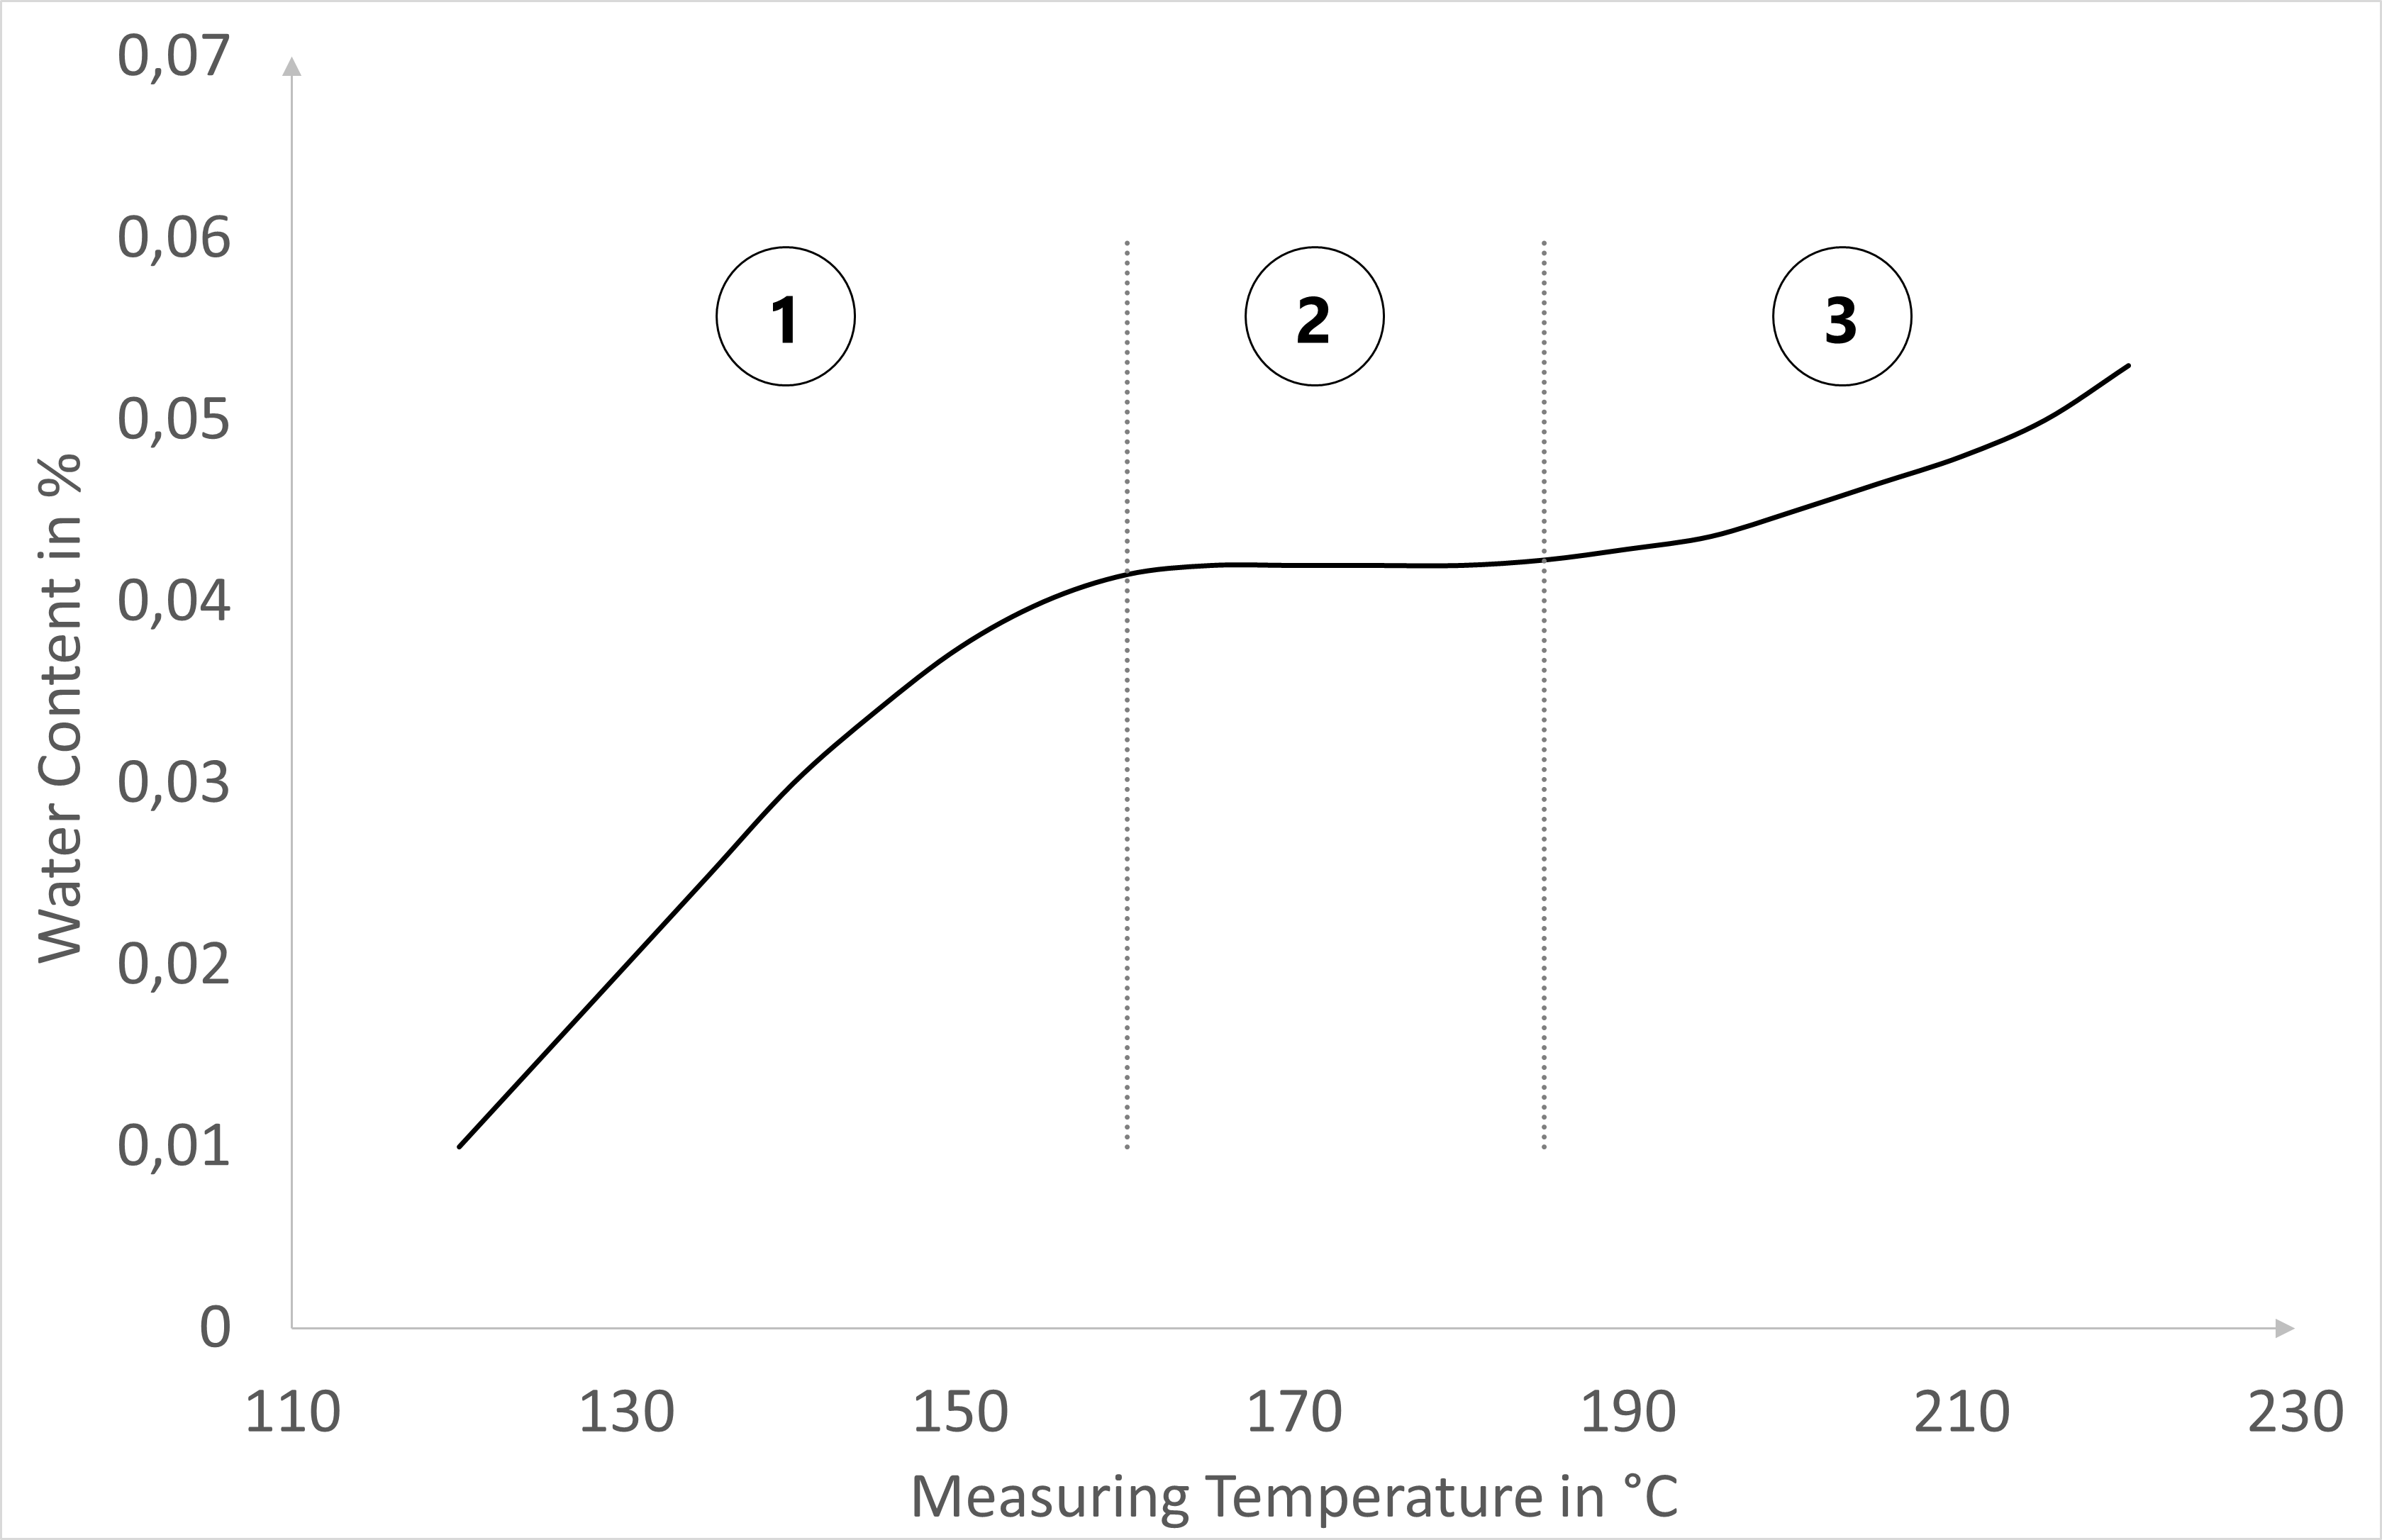
3. Interpreting the curve
A typical curve can be divided into three regions:
-
Too low a temperature: Water does not fully evaporate, causing measured water content to increase with temperature.
-
Optimal temperature range: Water content remains nearly constant. This range represents the ideal measurement temperature for the sample under the given conditions.
-
Too high a temperature: Apparent increases in water content are caused by water generated through thermal degradation or condensation reactions at high temperatures.
Practical Examples
The methodology above and the diagram illustrate the idealized approach for determining the optimal measurement temperature. In practice, factors such as material properties, additives, and processing conditions can influence the curve. Two real-world examples:
Example 1:
A biodegradable PLA-based plastic compound containing copolyesters and additives.
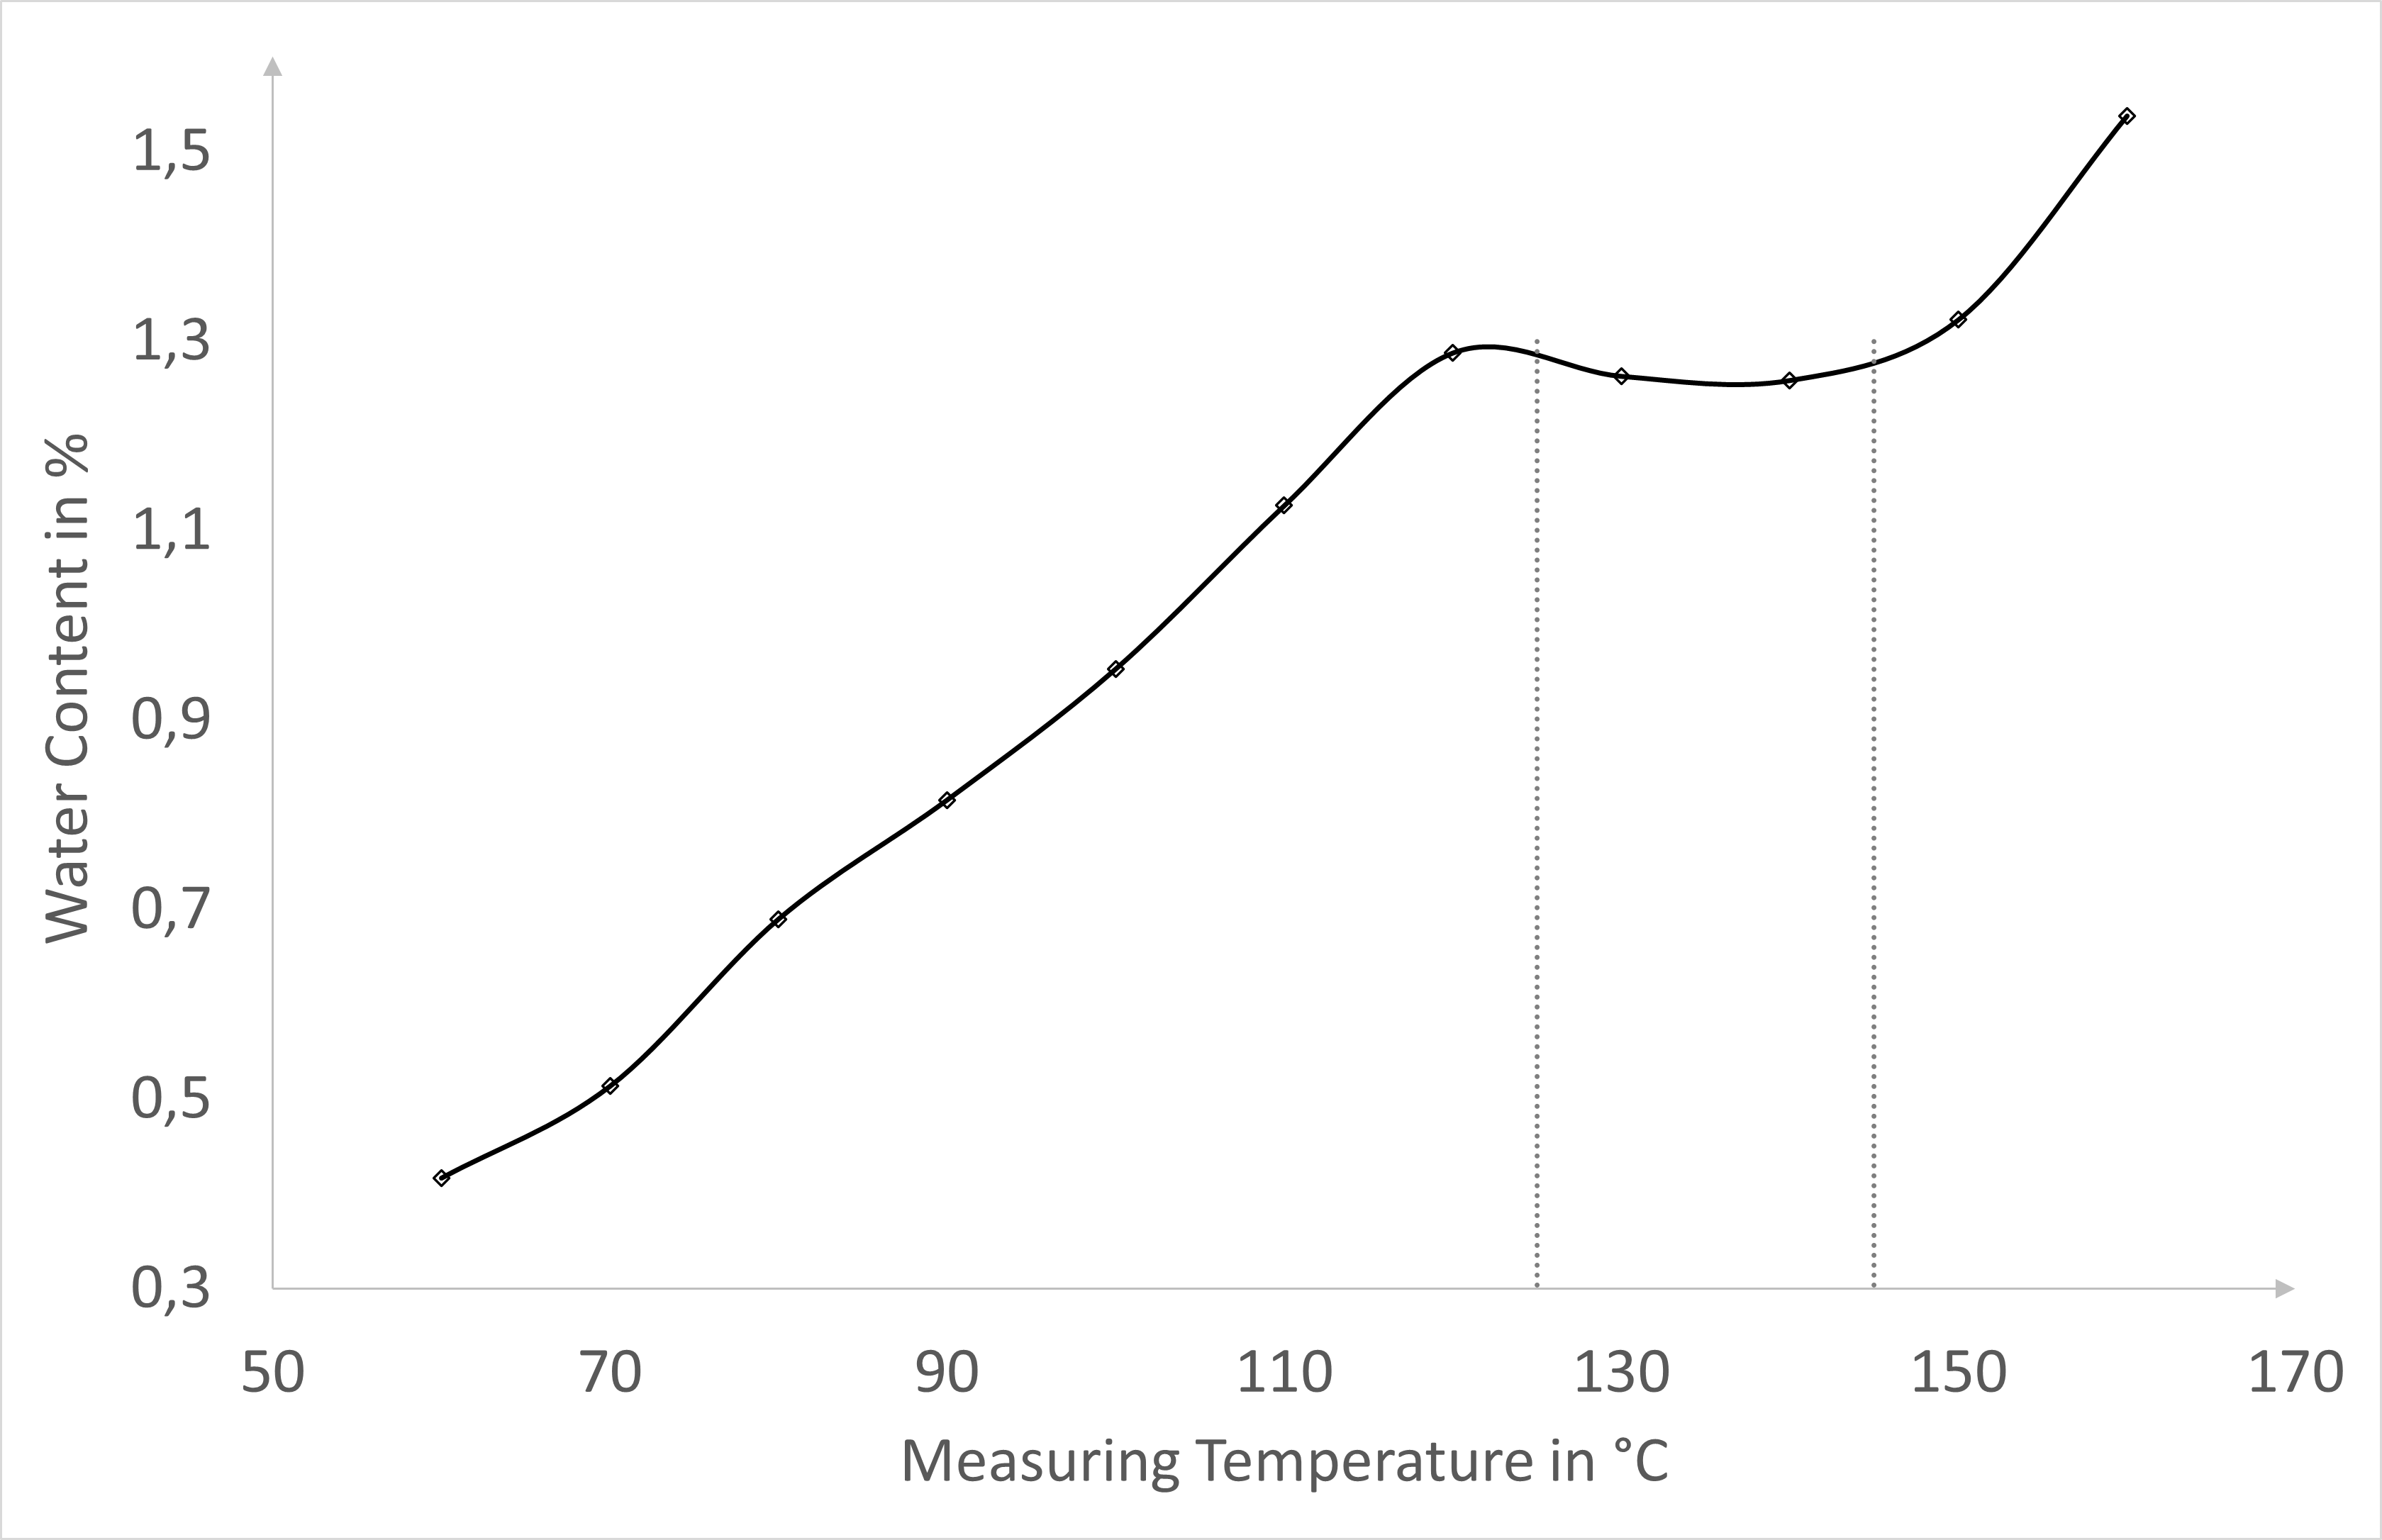
Measurements showed that at 60–125 °C, water did not fully evaporate; water content rose with temperature. The optimal range was 125–145 °C, where moisture content remained relatively constant, indicating complete measurement of the sample’s water content. Above 145 °C, water content increased again — not due to additional moisture, but likely due to thermal degradation or side reactions producing water.
Example 2:
Thermoplastic starch (TPS), biodegradable, based on wheat starch, containing glycerin as a plasticizer.
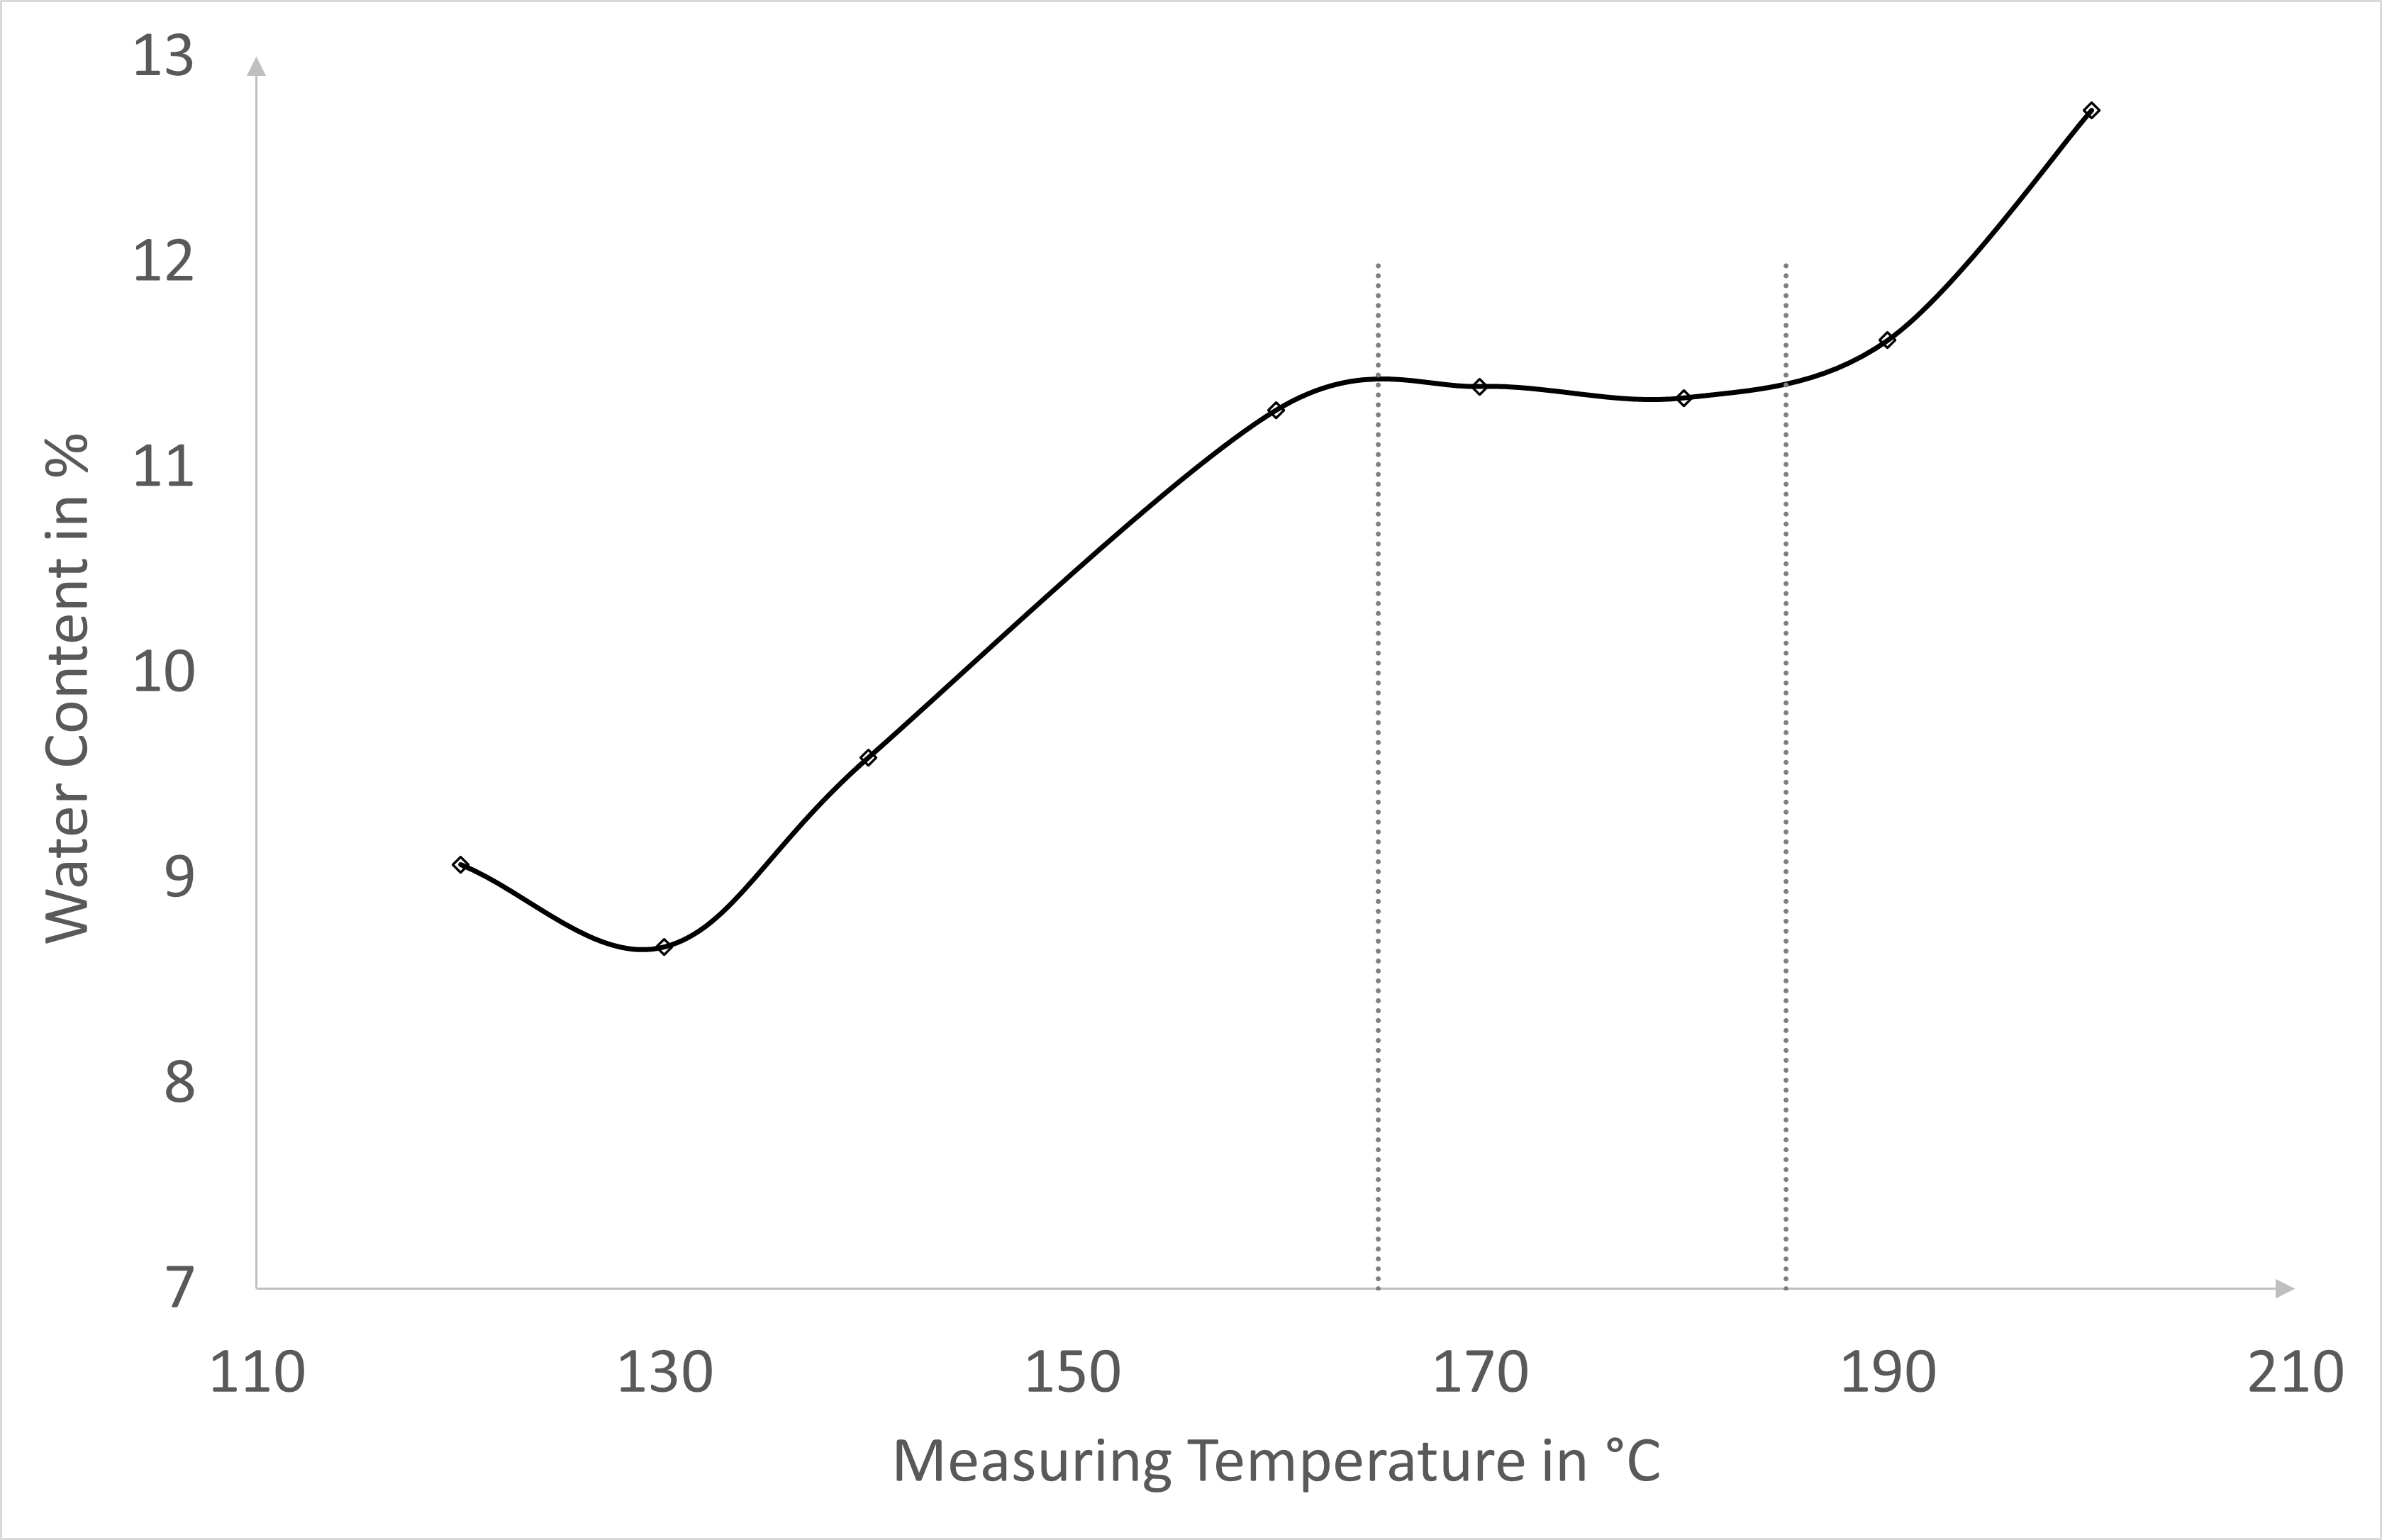
In the lower temperature range (120–165 °C), water content initially increased, then stabilized between 165–175 °C. Around 190 °C, water content appeared to rise again due to thermal decomposition of the starch, releasing additional volatile compounds.
Fazit:
Determining the optimal measurement temperature is critical for accurate moisture analysis. Systematic temperature variation, following standard protocols, minimizes measurement errors and ensures reproducible results.